Runway Report
The runway chart displays past and projected cash balances in a specific time basis. The cash balances are illustrated in a line graph and cash-ins and cash-outs are reflected in bar graphs. There is also a table underneath summarizing the following information:
- Starting balance
- Cash-in
- Cash-out
- Net cash
- Ending balance
Related Articles
How To Change Time Basis on Runway Report?
Cash Transit Zone
The cash transit zone lists individual cash transactions within selected time frame. Click on the entry to edit the information in the entry.
Related Articles
Filter Cash Entries in Cash Transit Zone
Edit or Delete a Cash Entry in Cash Transit Zone
Change Payment Date of a Cash Entry in Cash Transit Zone
Monthly Snapshot
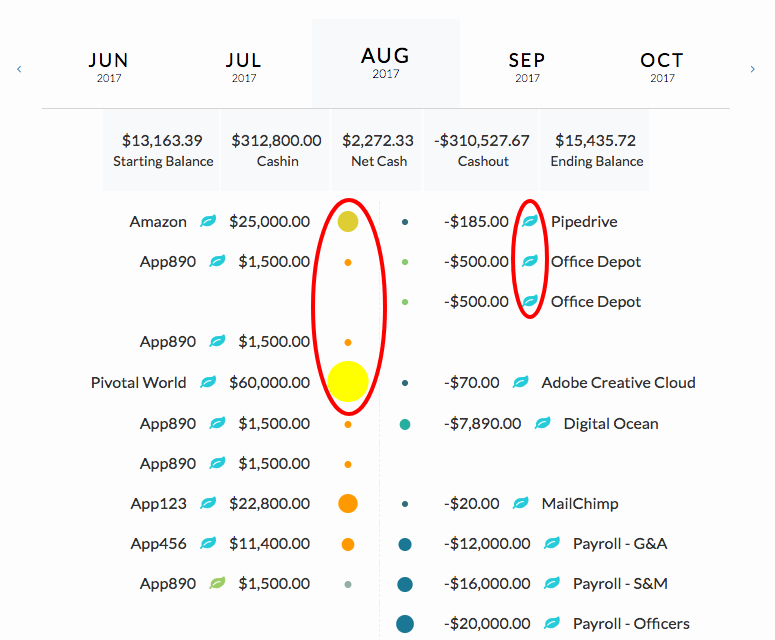
The monthly snapshot summarizes cash-ins and cash-outs of a particular month. Cash-ins are listed on the left side and cash-outs are listed on the right side. The different colors and sizes of bubble dots indicate different groups of revenues and expenses. The leaf icons also display the status of the cash entry.
Examples of the visuals and icons are highlighted in red below:

