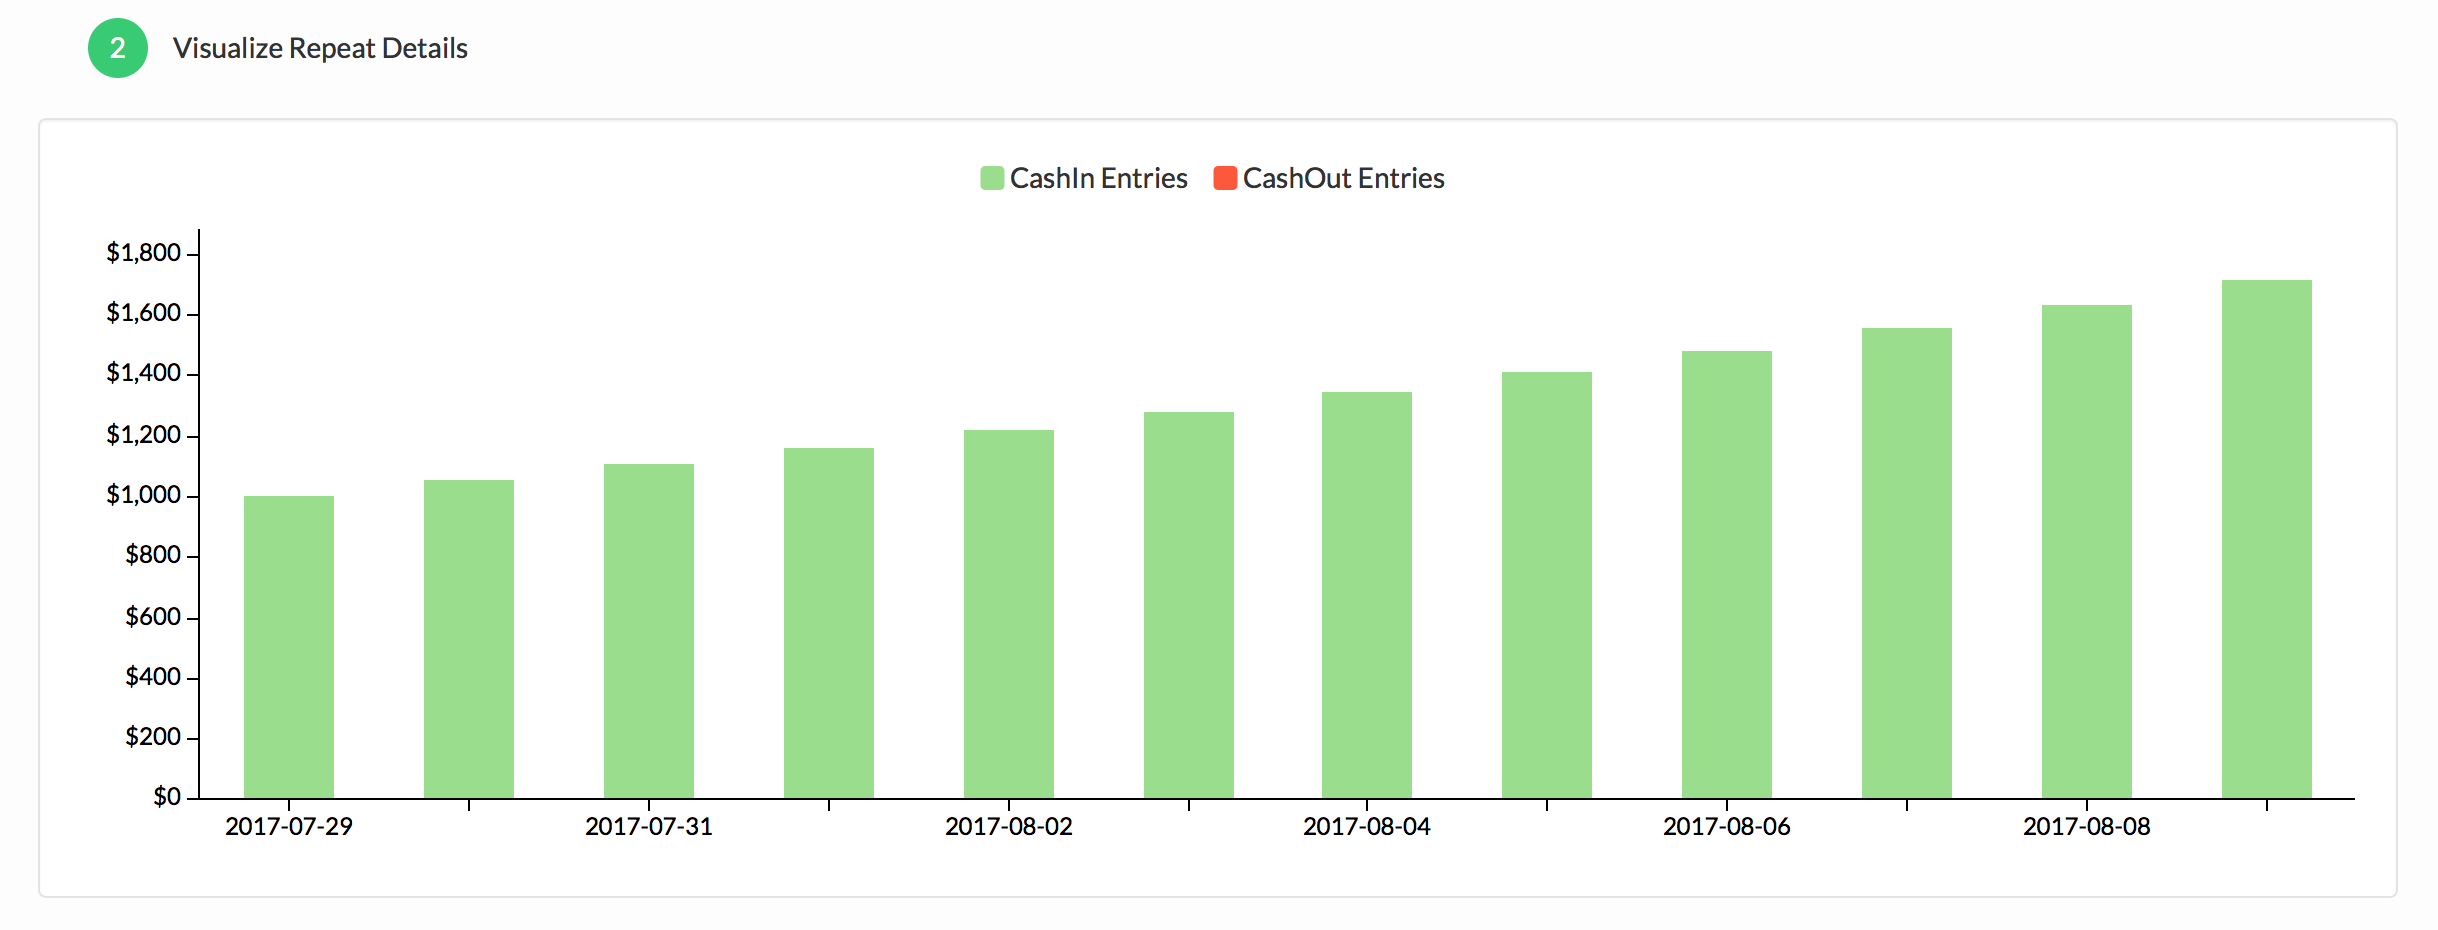
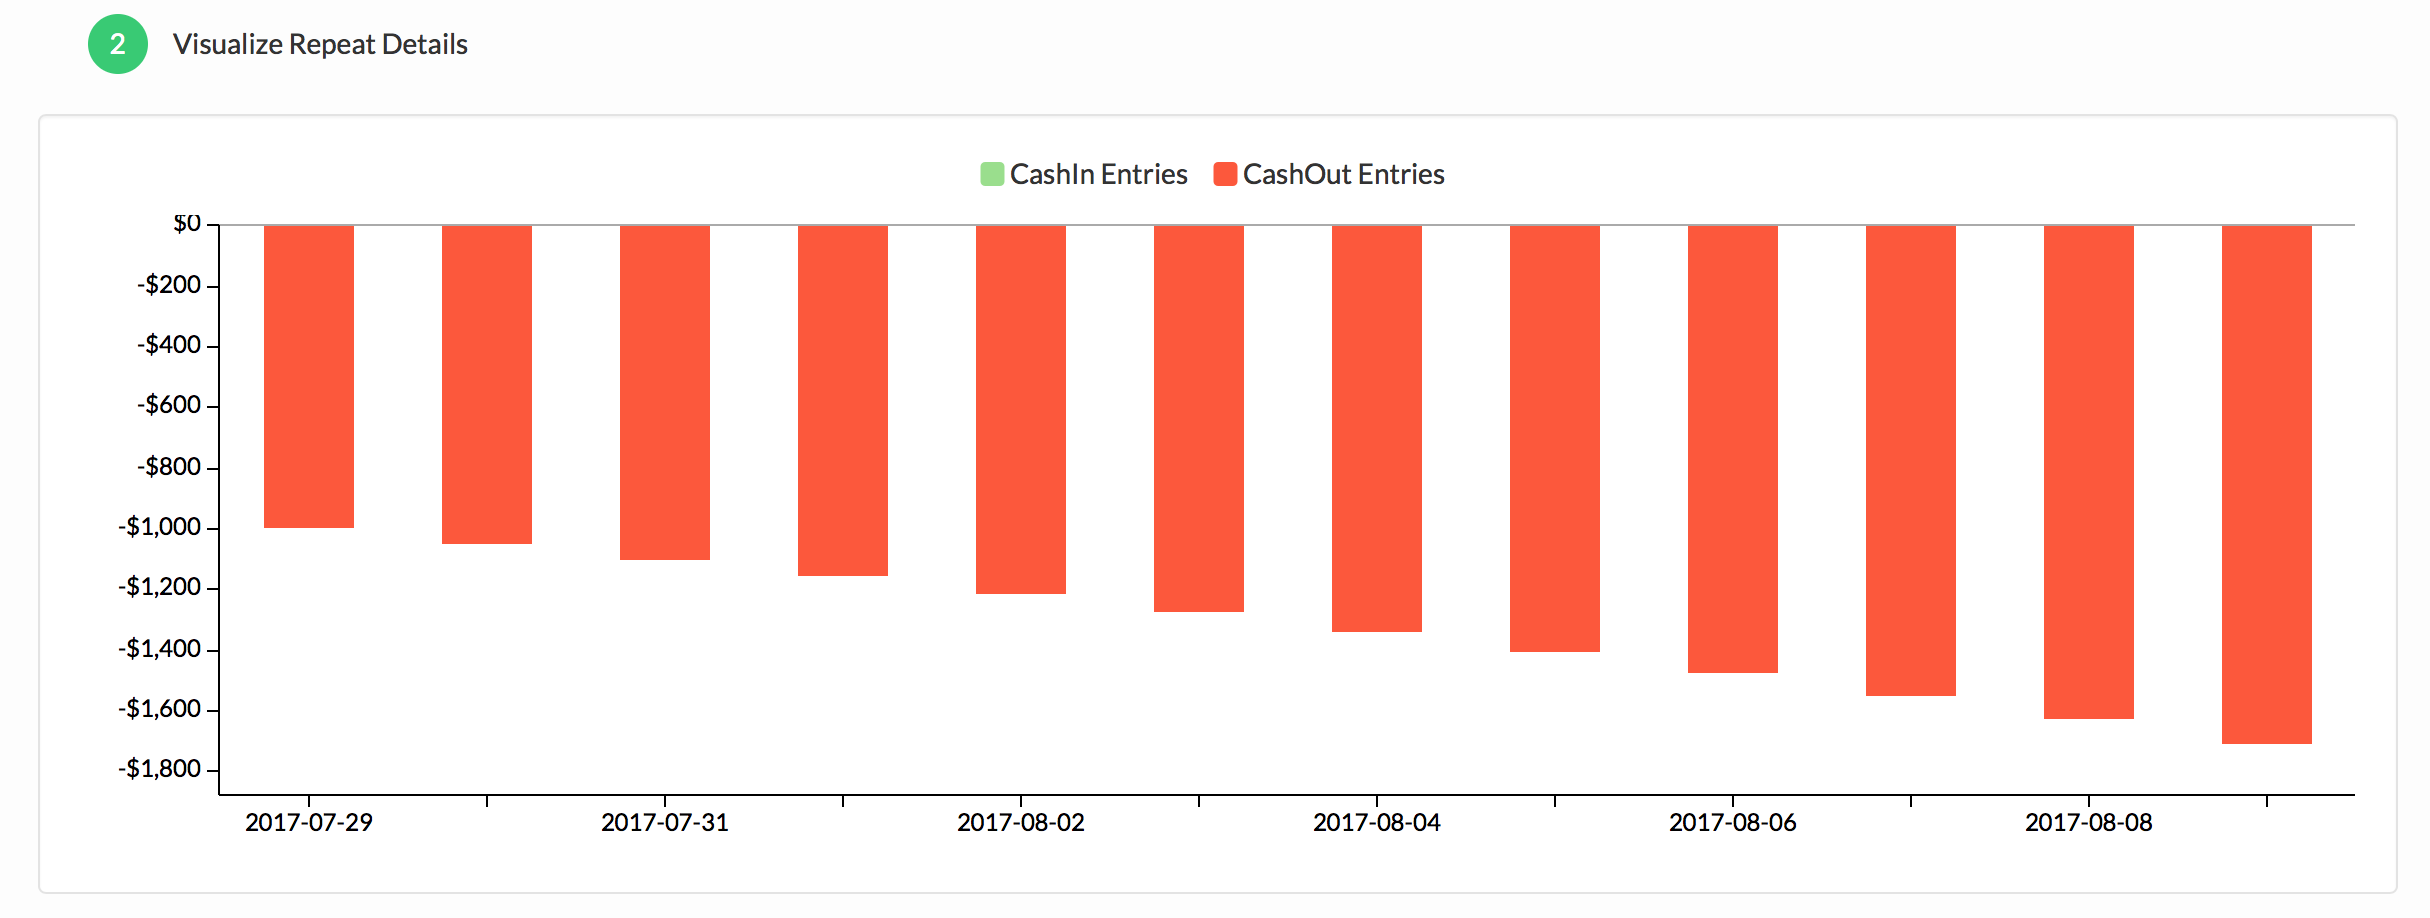
Once your cash entries are entered, the Visual Repeat Details area will give you a visual way to measure your cash.
To see your Cash-In Entries in a bar graph:
- In Section 1, “Select Repeat Type, Amount and Frequency,” make sure to select “Cash-In.”

- In Section 2, “Visualize Repeat Details,” you will see your Cash-In entries in green.

To see your Cash-Out Entries in a bar graph:
- In Section 1 “Select Repeat Type, Amount and Frequency,” make sure to select “Cash-Out.”

- In Section 2, “Visualize Repeat Details,” you will see your Cash-Out entries in red.

Related Articles
How Do I Input a New Projection?
