The visuals give you a clearer look at your entries and categories and the weight each one holds.
To open your visuals view:
- On the right side, find the button labeled “Visuals”
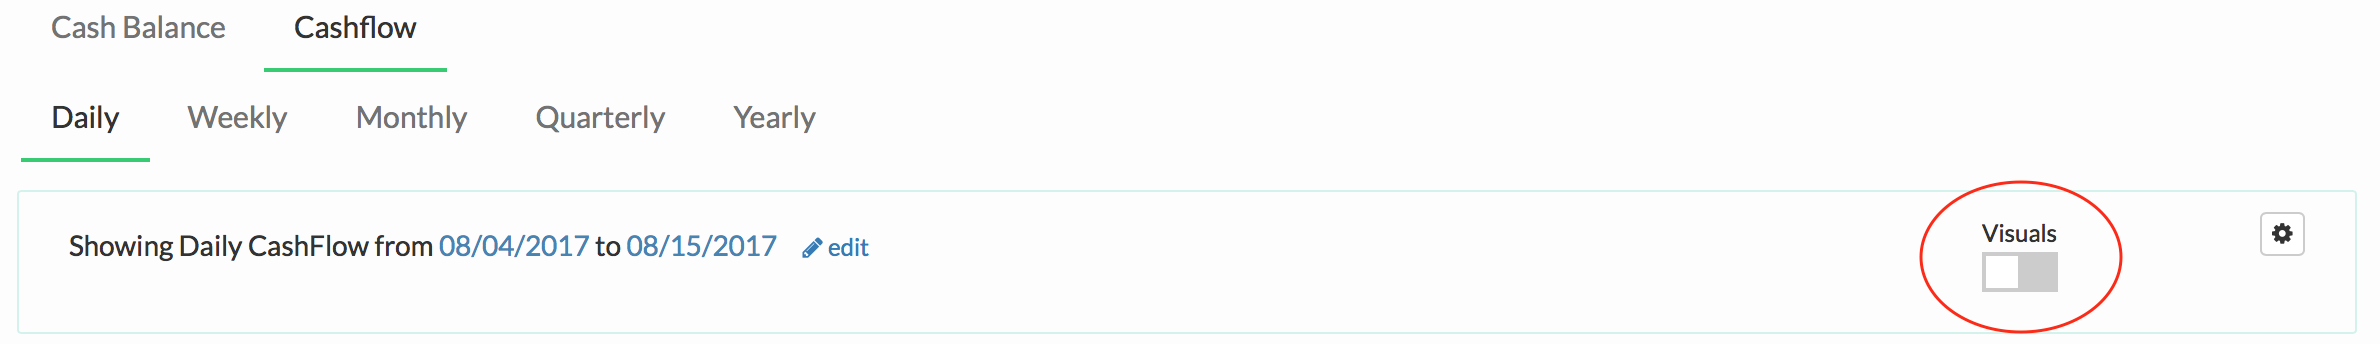
- Clicking the grayed out area switches the visuals button from off to on

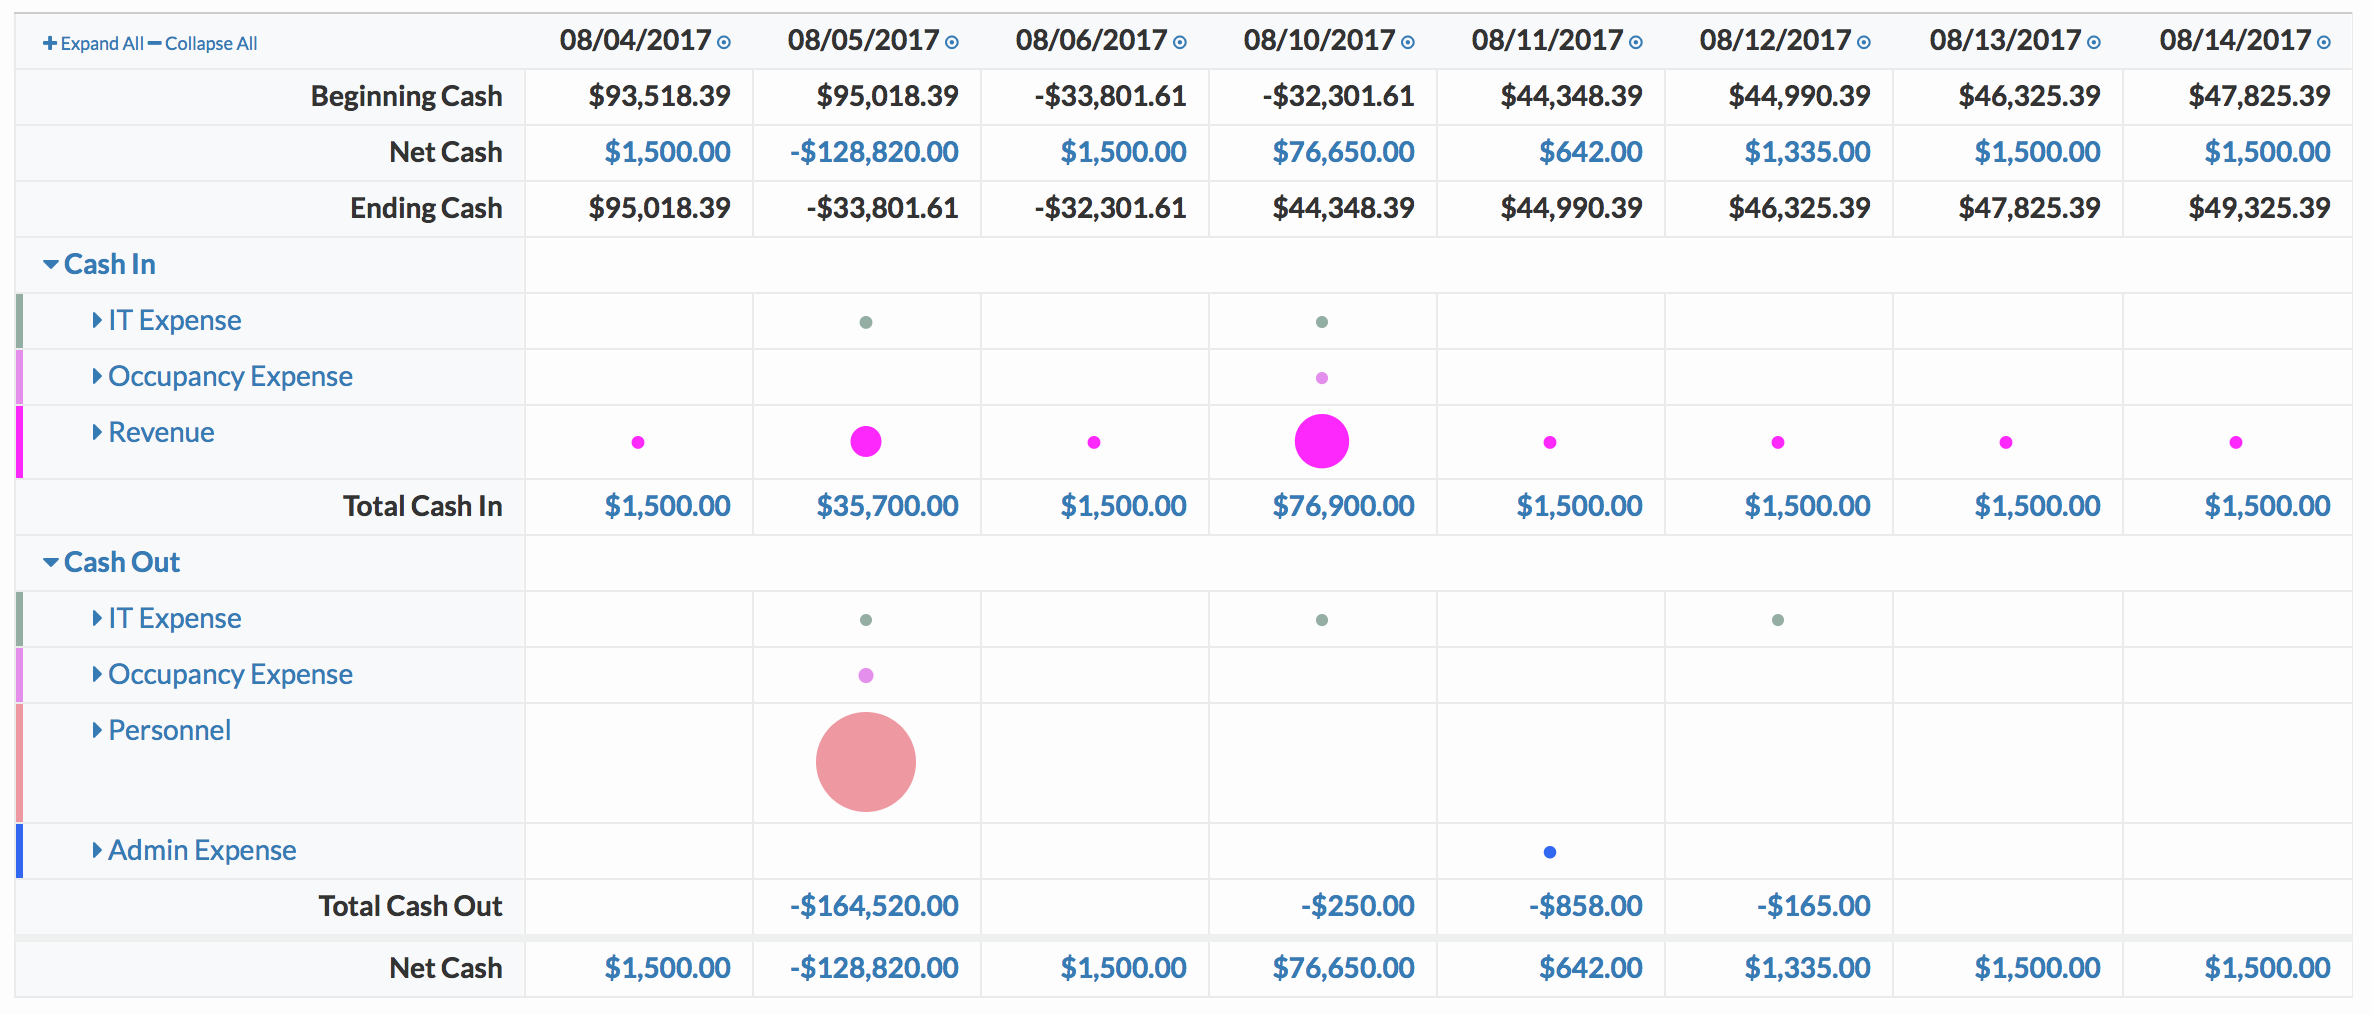
Your chart will now include colored dots. The colors coordinate with your categories, and the larger the dot, the larger the amount. The smaller the dot, the smaller the amount.
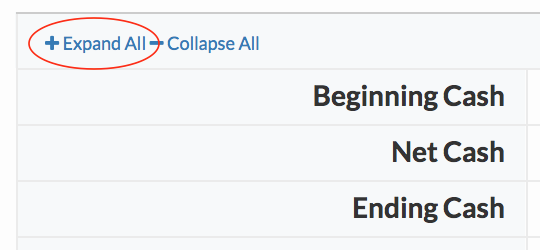
Expanding your view:
- Click on the + (plus sign) to expand your visual view of what is cashed-in and what is cashed-out. This allows you to see your data more in depth.
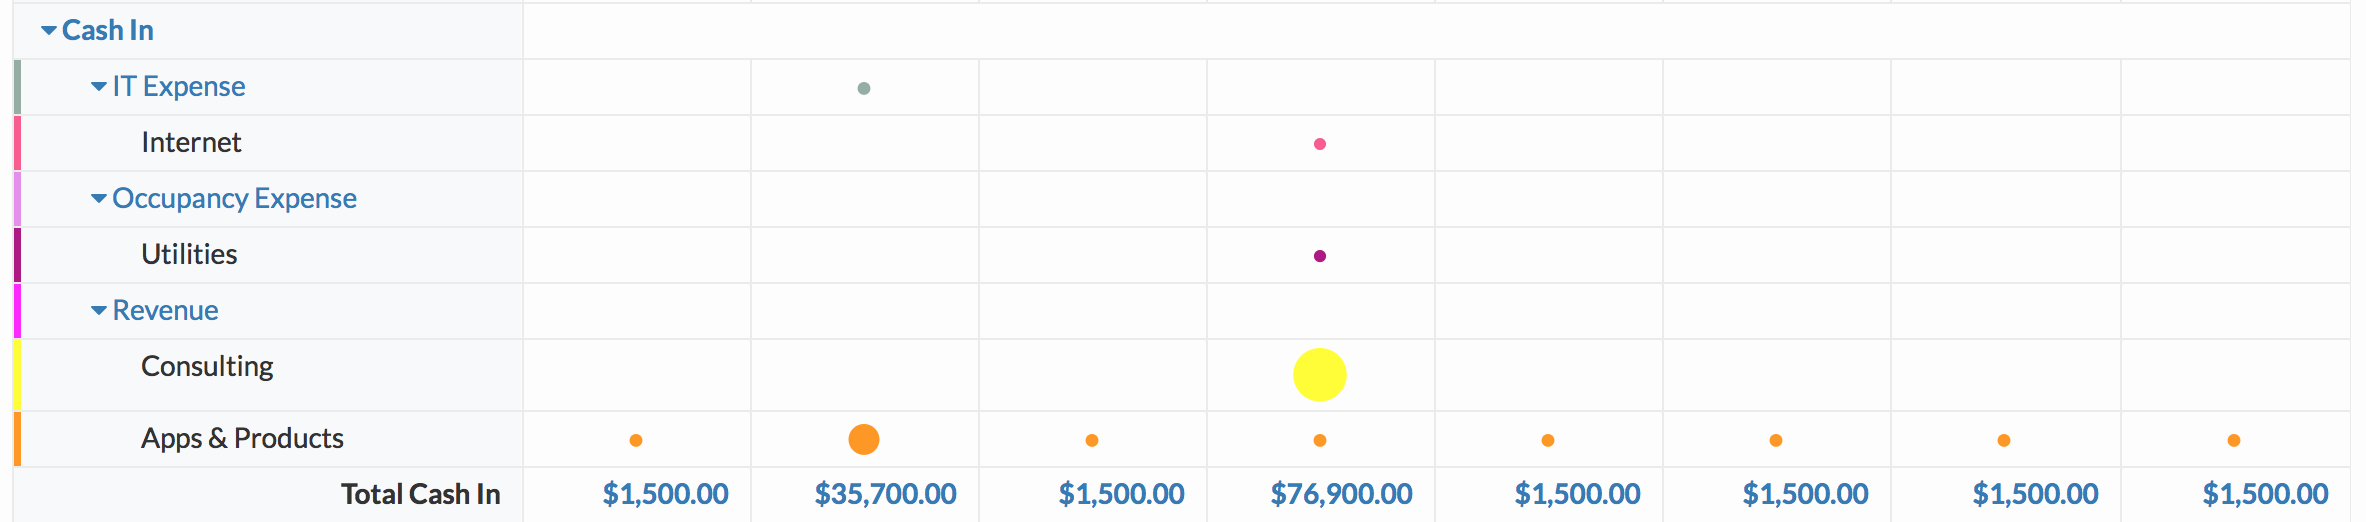
- Here’s an example of the expansion of what is cashed-in. You can see that the biggest contributor to this company’s Revenue is Consulting, rather than Apps & Products.
Related Articles
Changing Time Basis on the Runway Report
Edit or Delete Cash Entry in Monthly Snapshot
Select Time Basis in Cash Summary
Graph and Table Showing Cash Inflows and Outflows
Select Type of Schedule Basis: Daily, Weekly, Monthly, Quarterly, and Yearly