The cash flow charts can show you the ins and outs of your money.
To switch between the different schedules (daily, weekly, monthly, quarterly or yearly):
- Click on the desired tab to easily and quickly toggle between the different time durations.

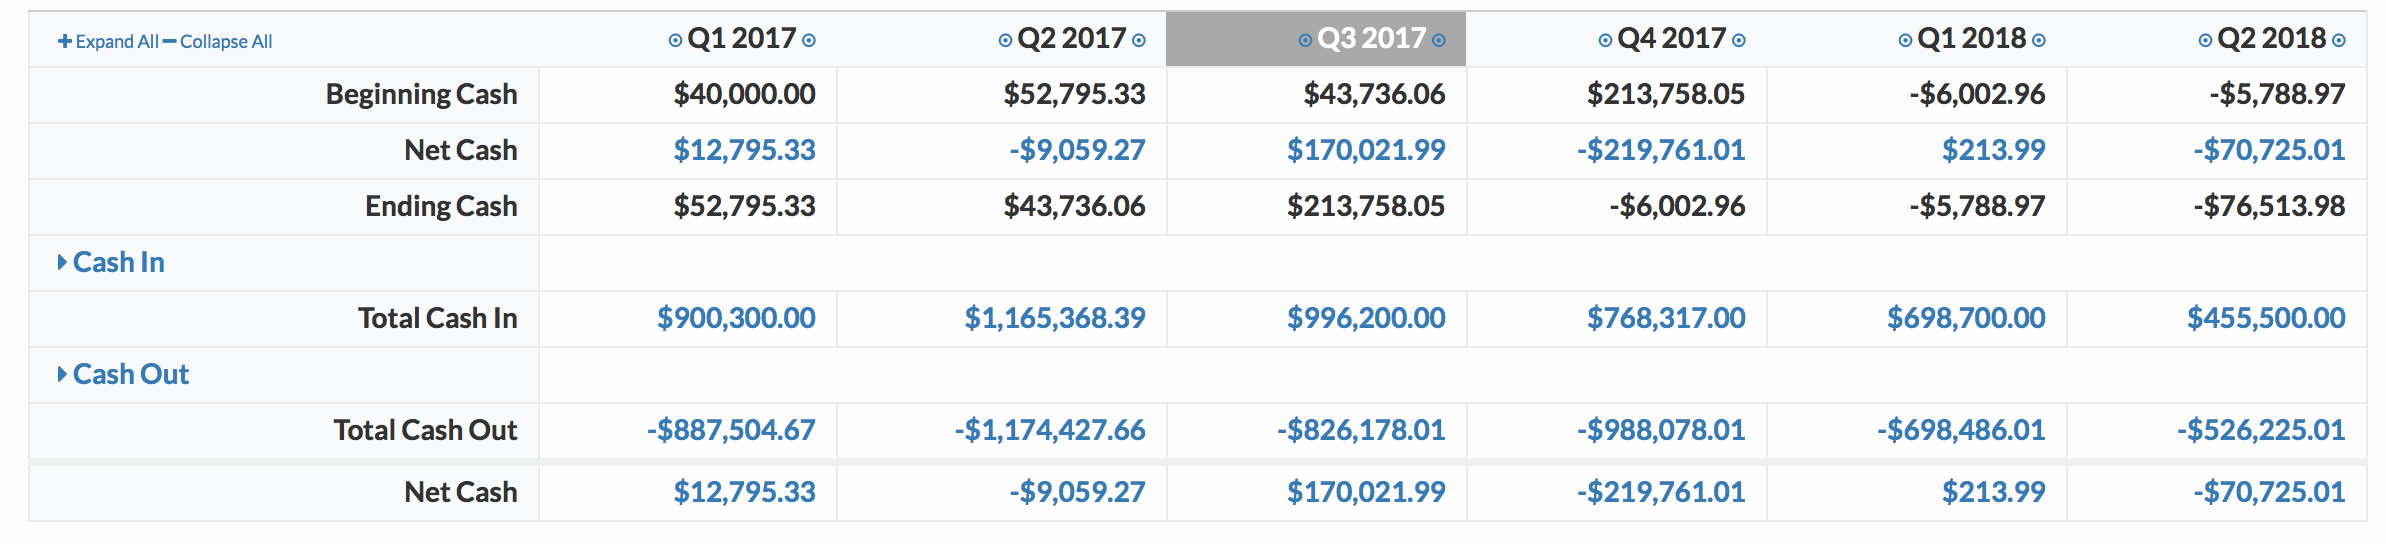
- Here’s an example of a quarterly cash flow chart:
Related Articles
Changing Time Basis on the Runway Report
Edit or Delete Cash Entry in Monthly Snapshot
Select Time Basis in Cash Summary
Graph and Table Showing Cash Inflows and Outflows