The cash flow chart gives you a visual look at where your money is coming from and going to.
An example of a cash flow summary chart:
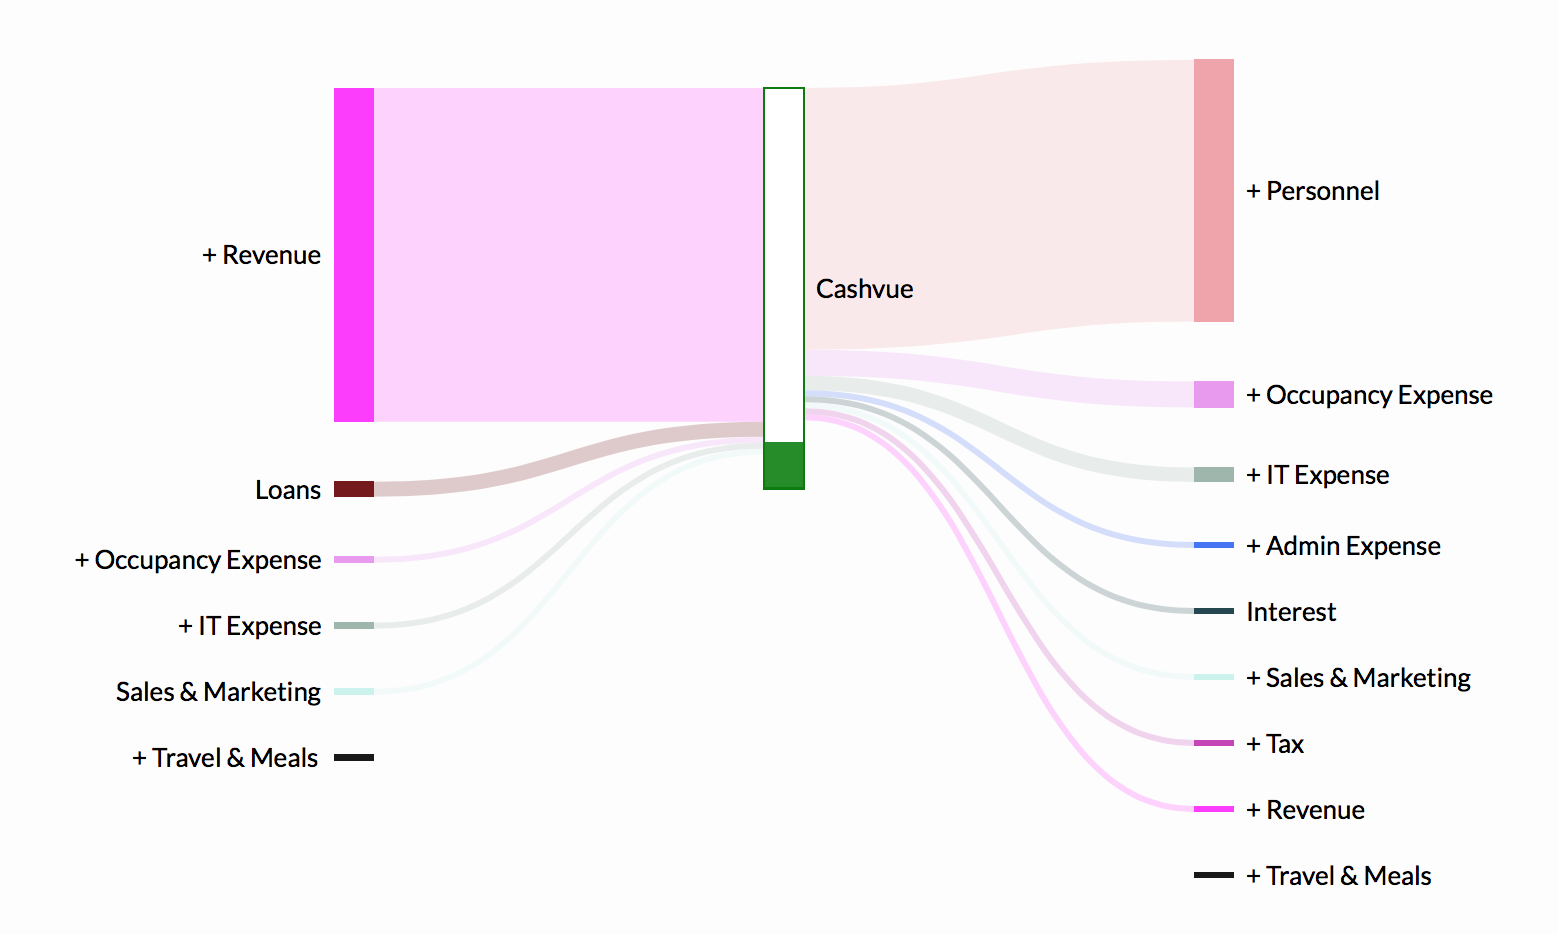
- The bar down the middle indicates your cash balance.
- On the left of it, you have your cash-ins; on the right of it, the cash-outs.
- Again, everything is color-coded by category. You can easily see which is the largest sources of cash-in and cash-out for you – the thicker the lines, the more weight is has in cash.
To look at what makes up each category:
- Clicking on the words “expand all” in the right-hand corner of your screen.

- Doing so opens up each category so you can see a break down of what expenses make up each one. It will look similar to this:
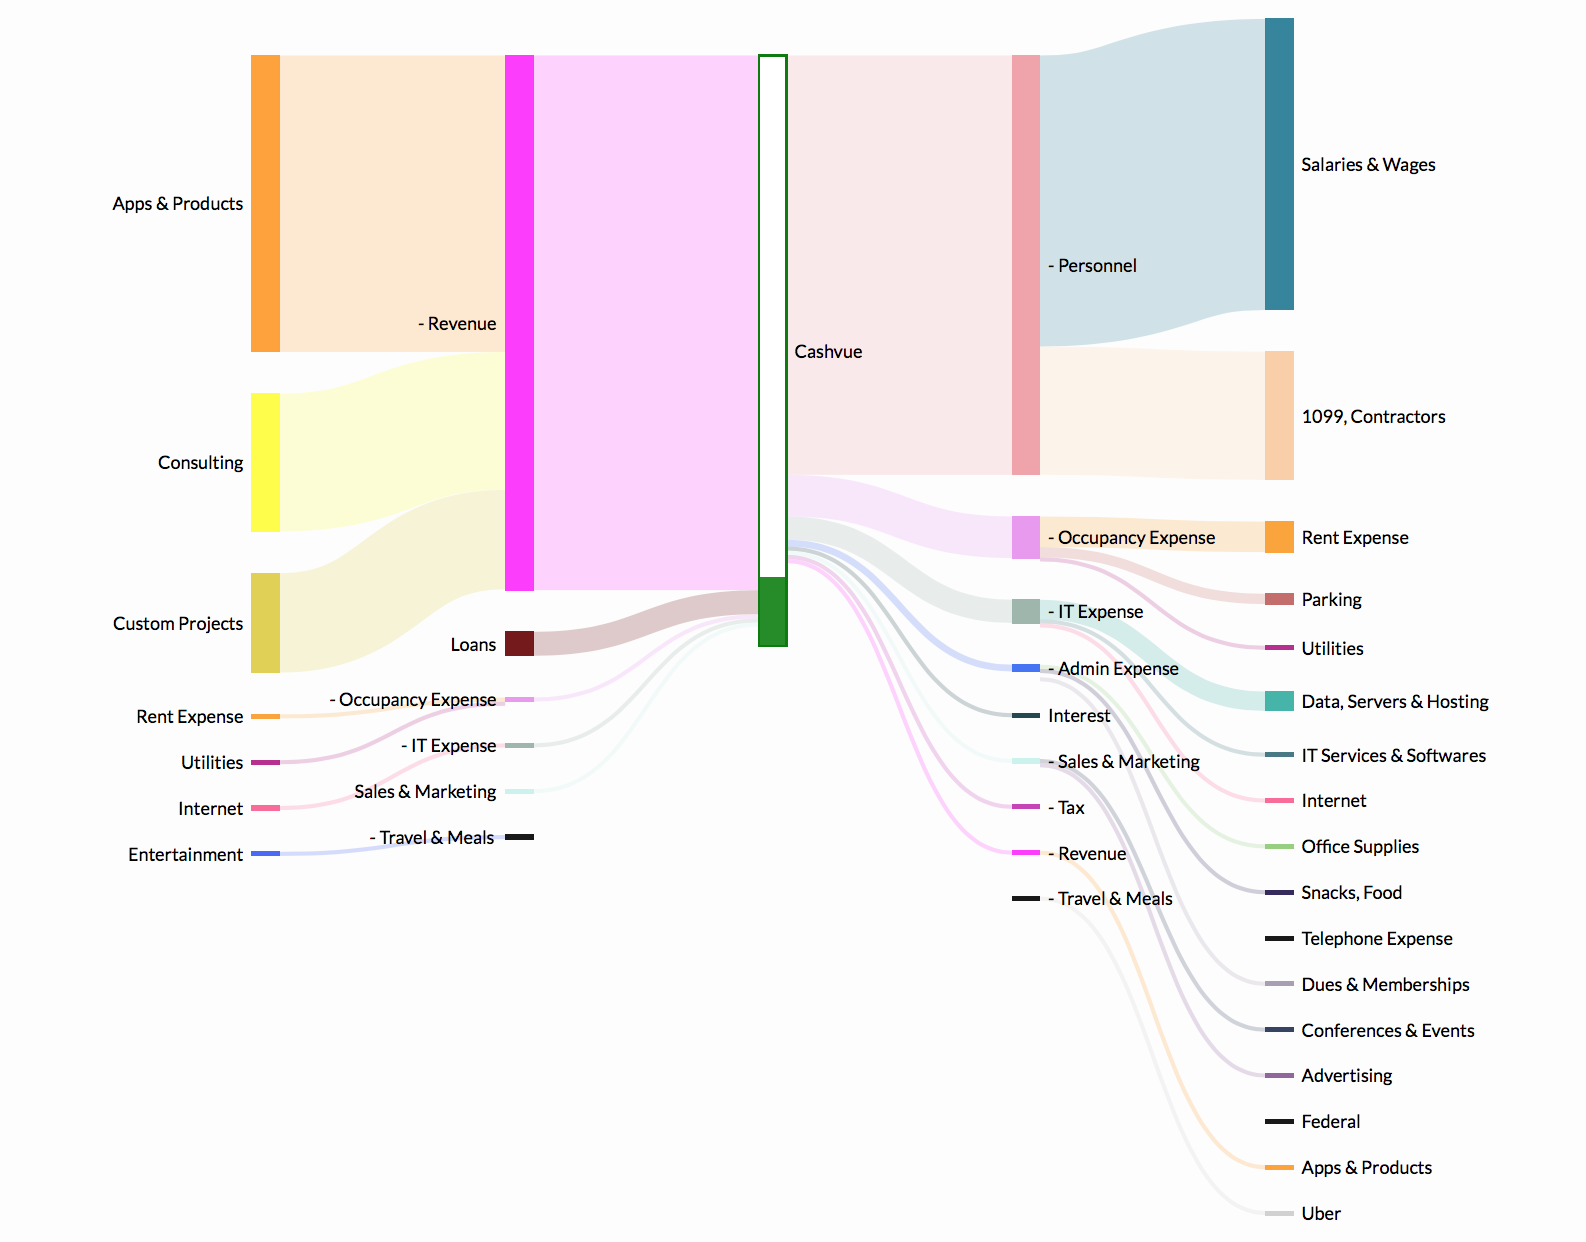
- On the left side, you can see how Revenue is now broken down into Apps and Products, Consulting and Custom Projects.
- To go back to a less detailed view, click on Collapse All.
Related Articles
Sort Cash Transits by Time in Cash Transit Zone
Filter Cash Entries in Cash Transit Zone
Change Payment Date of a Cash Entry in Cash Transit Zone
Change Entry Status of a Cash Entry in Cash Transit Zone
Edit, Clone, and Delete a Single Cash Entry
Sort Your Cash Timeline by Dates
Visuals to Help Focus on Big Transactions