Your Timeline gives you a look at your cash-ins and cash-outs in chronological order. It also gives you a very visual look at your transactions, through color-coded circles, or bubbles.
These bubbles are associated with your categories, but in your Timeline, the bigger the bubble, the bigger the transaction.
Here’s a look at an example:
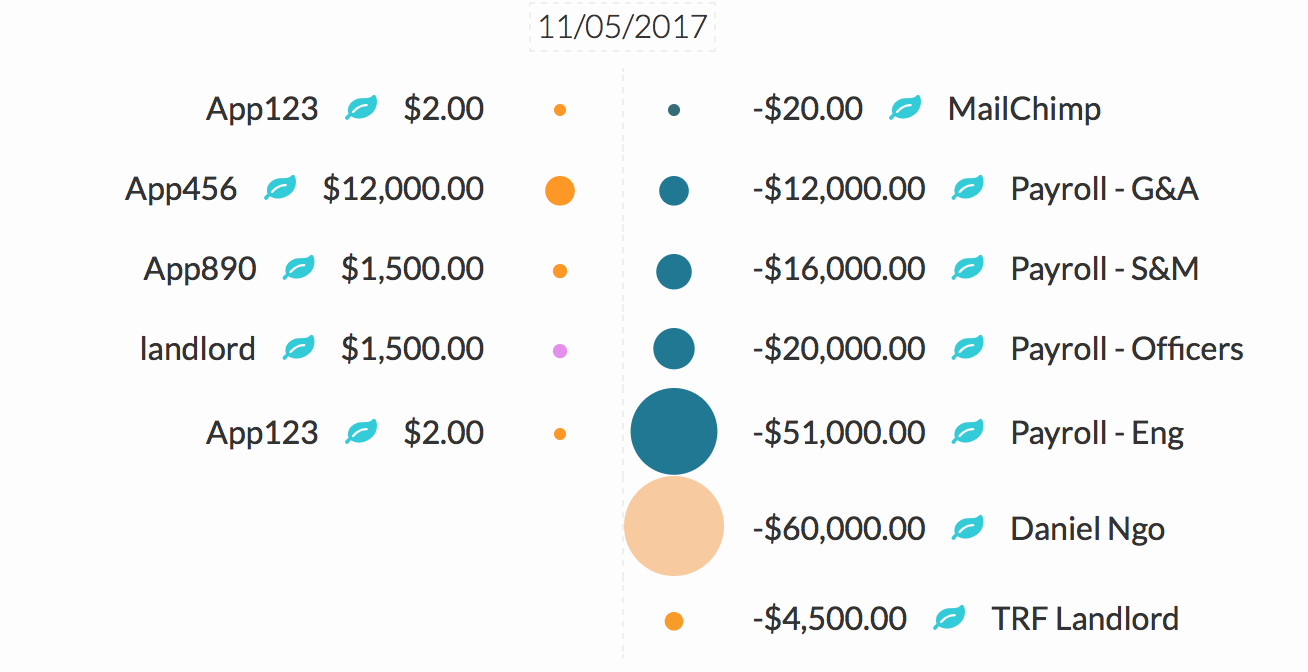
Most of these cash-out entries belong to the same category, and have the same blue color bubbles. But look at the size of the bubbles! The largest bubble is the largest cash-out for $51,000. The bubbles go down in size as the cash-out amounts go down as well.
A quick glance in your Timeline for the largest bubbles can help you easily find the largest transactions.
Related Articles
Sort Cash Transits by Time in Cash Transit Zone
Filter Cash Entries in Cash Transit Zone
Change Payment Date of a Cash Entry in Cash Transit Zone
Change Entry Status of a Cash Entry in Cash Transit Zone
Edit, Clone, and Delete a Single Cash Entry
Sort Your Cash Timeline by Dates
How To Save an Image of My Cash Flow Summary?