
Another way to visually view your cash entries is in the Category Charts.
Accessing the Category Charts:
- Go to Visuals, and then select on Category Charts.
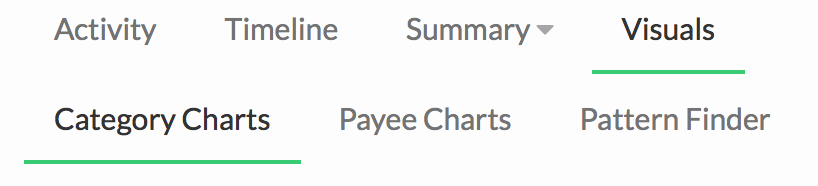
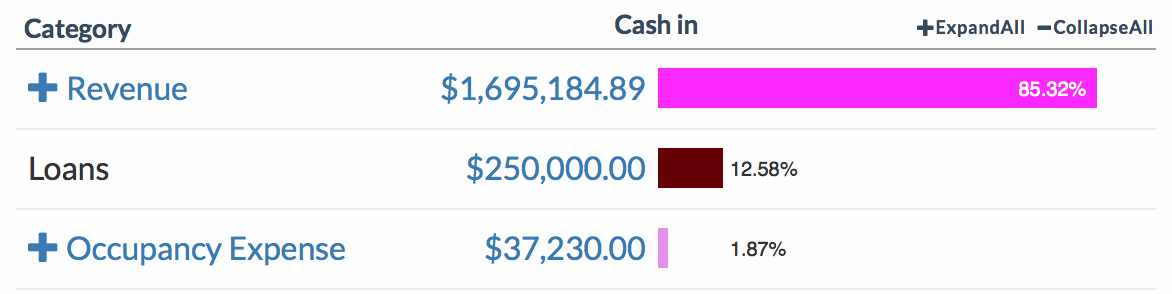
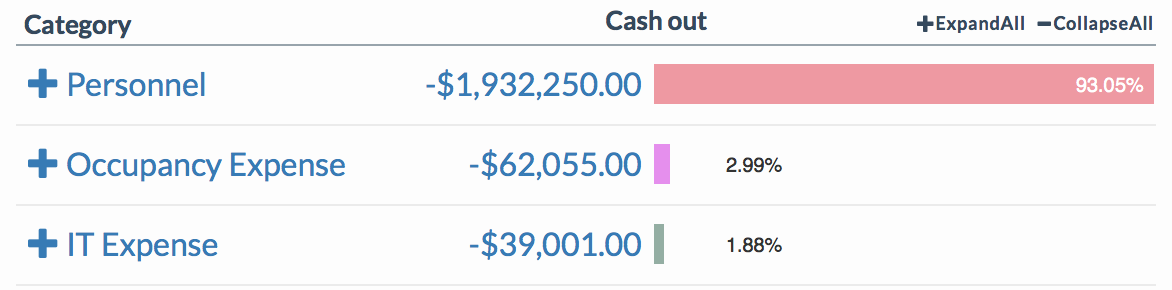
- Here you will see your cash-ins and cash-outs as percentage bars.
Viewing the details:
- Pick a category.
- Click the + sign next to the category name.
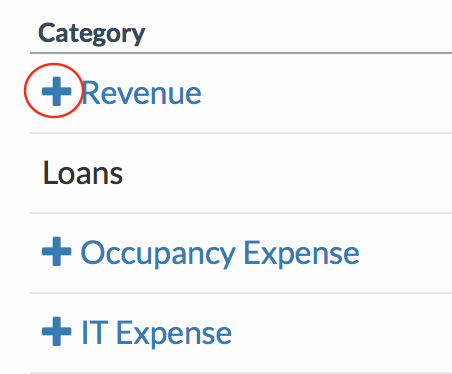
- The main category will open up to a detailed breakdown, with each sub-category having it’s own color-coded percentage bar.
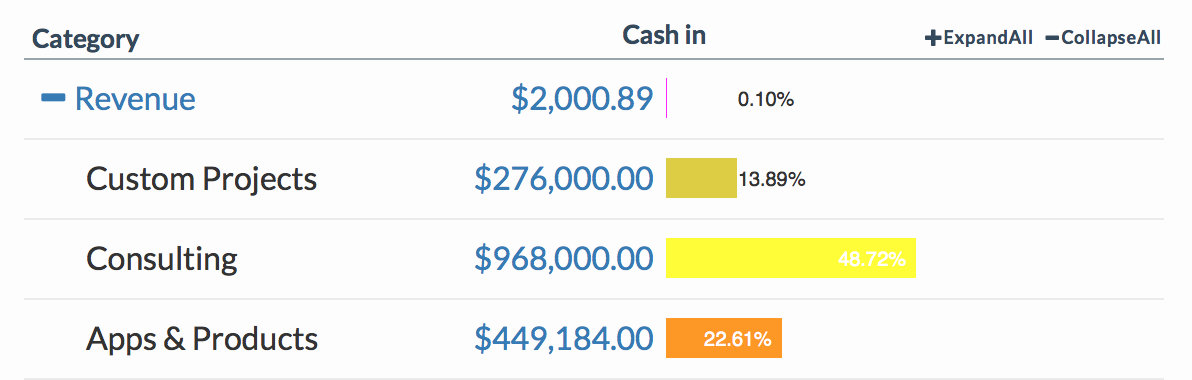
- Additionally, you can click “Expand All” to open up all the categories.
Related Articles
Sort Cash Transits by Time in Cash Transit Zone
Filter Cash Entries in Cash Transit Zone
Change Payment Date of a Cash Entry in Cash Transit Zone
Change Entry Status of a Cash Entry in Cash Transit Zone
Edit, Clone, and Delete a Single Cash Entry
Sort Your Cash Timeline by Dates
Visuals to Help Focus on Big Transactions
How To Save an Image of My Cash Flow Summary?